TL;DR
- Getting lots of organic keywords is not easy or cheap.
- Here is a process to get unlimited keywords from Search Console for free!
- Report them all through Google Data Studio for quick insights!
One of the tougher parts of SEO is not having access to all keywords that lead users to your site. Google Analytics shows (not provided) for 99.9% of keywords and we are limited to 500 keywords in Google Search Console. If Google wants us to optimize for our users, why won’t they show us the keywords they are searching???
Because of this many in the industry have come up with a workaround to get past these limits and find great ways to get access to numerous keywords to help their content efforts. Some of these require programming knowledge to connect API’s and others require money to connect premium services. Both are great options, but not everyone has the ability to accomplish these.
This led me to find my own workaround to get unlimited Google Search Console keywords for free in Google Sheets. I then upload them to BigQuery and report them through Google Data Studio in an easily digestible format. BigQuery accelerates the reporting which is very handy when you are sorting through thousands of keywords. In this post, I’ll break down this process and provide a free template that is very actionable.
See Also – Google Search Console Bulk Data Export
Step 1: Download Google Sheets Extensions
Install both of these extensions in Google Sheets under the same account as your Google Search Console properties.
Step 2: Request Google Search Console Data In Google Sheets
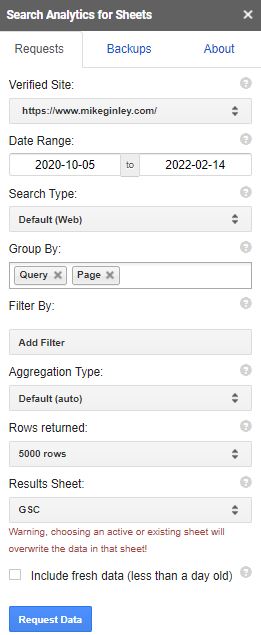
Now it is time to get your keywords. Under Extensions navigate to Search Analytics for Sheets and open the sidebar.
- Choose the GSC property
- Select your date range
- Group terms by (I use query and page)
- Add any filters (this can be helpful for larger sites)
- Choose where to return the data (new sheet or choose to replace data)
- Request Data
This may take a second depending on how much data you are requesting. I like to limit most of mine to 10,000 terms just to speed it up. I also rarely need more data than that. If I do I break them up by folder types or sections of the site.
Step 3: Import Data Into BigQuery
Now we can send this data into BigQuery using OWOX BI BigQuery Reports.
Navigate to Extensions and select the tool and choose Upload data to BigQuery.
You will need to have a BigQuery account set up with a project active. Here are some good tutorials to help you with that and take this report a step further!
- SEO reporting with Google Big Query & Data Studio
- How to Track Total Rankings in Data Studio With BigQuery
If/when you have BigQuery setup you can select the Project ID, Dataset ID and Table ID. You will want to remember these if you are doing this process for multiple sites. It is very easy to update this data whenever you need it, you just need to stay organized when creating them.
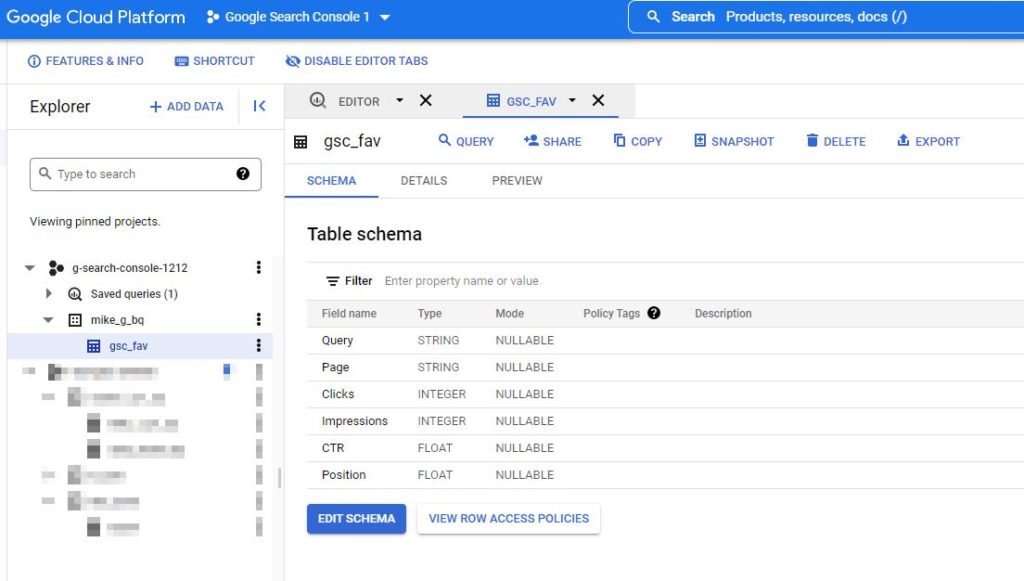
Before starting the upload you need to set the Table schema. After you set this up once for a Table ID, it’ll be remembered for any future use if overwrite the data (which is why you want to remember your setups).
- Query = String
- Page = String
- Clicks = Interger
- Impressions = Interger
- CTR = Float
- Position = Float
If this is your first time adding data that is all you need to do. If your table already exists and you are updating the data, choose Truncate to overwrite the old data.
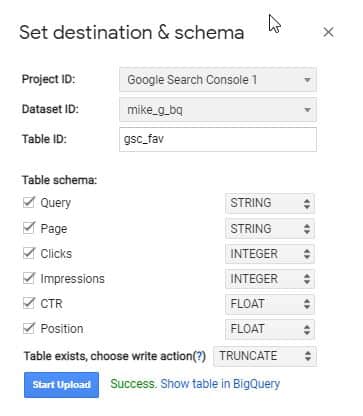
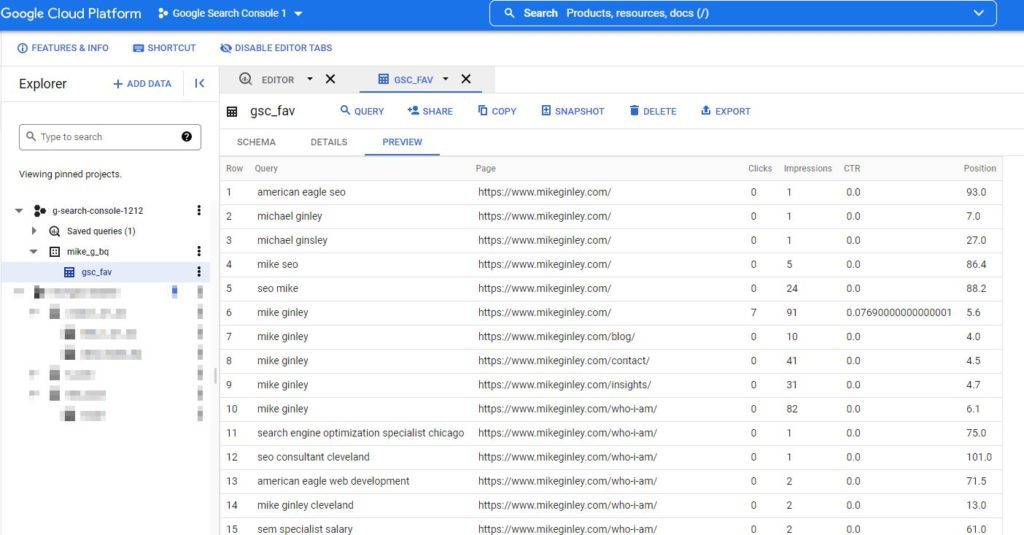
You will see Success when the data is properly uploaded to BigQuery. You never really even need to mess around in BigQuery for this process besides setting up the project and table, but if you are curious you can preview the table and schema like below.
Step 4: Google Data Studio Setup
The data should all be in BigQuery so now we can set that up as a data source in Google Data Studio.
Here is a free Google Data Studio template to speed it up for you! Make a copy and change it up any way you want.
After you make a copy in the top right you will want to change the Manage Added Data Sources under Resource.
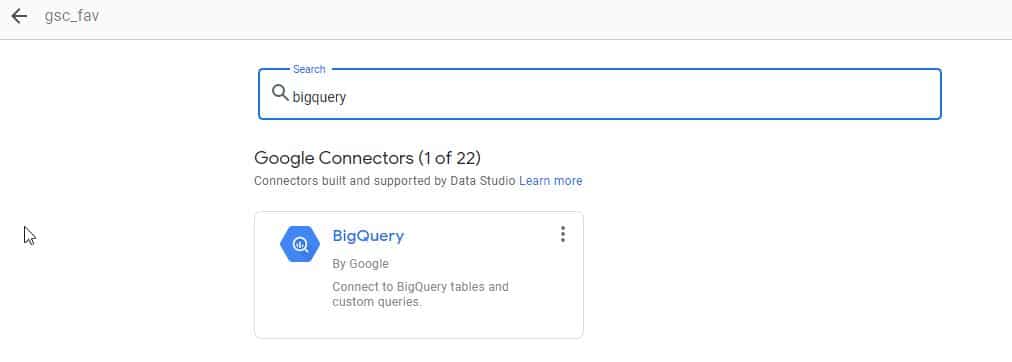
- Choose Add A Data Source
- Search for BigQuery
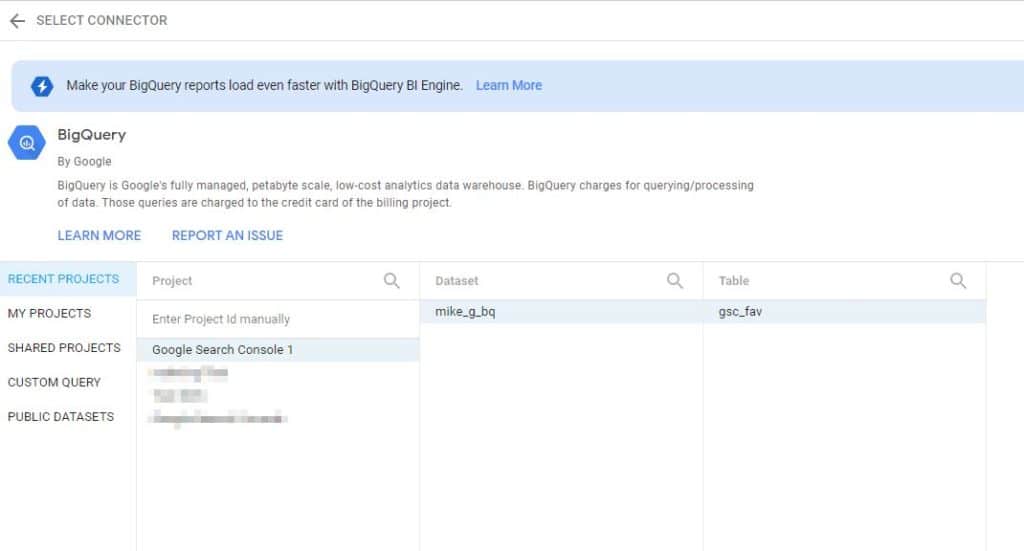
- Select Your Project ID
- Select Your Dataset ID
- Select Your Table ID
- Hit Add in the bottom right
Step 5: Change The Data Source
You can hold down the shift and click on each table and filter to control the data sources. There are 2 different data sources in the report so just focus on the top one for now. The bottom one is a regular old Google Search Console to show a trend, nothing fancy.
Select the BigQuery Data source you just set up (it will show 0 charts active) and you can delete mine so it doesn’t slow down your report.
The table should stay the same, but if anything gets messed up here is the breakdown.
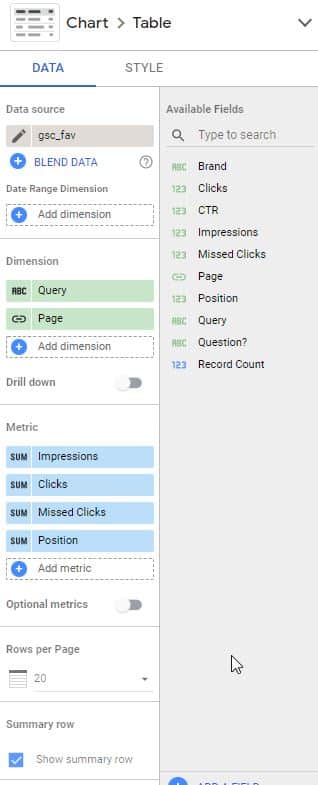
Step 6: Add Filters
Here is the process of how to add custom filters in Google Data Studio.
Brand
CASE
WHEN REGEXP_MATCH(Query, “(?i).INSTERT BRAND.“)THEN “Brand”
Else “Non-Brand”END
Question
CASE
WHEN REGEXP_CONTAINS(Query, “^(?i)(aren’t|can|cant|can’t|cannot|could|couldnt|couldn’t|did|didn’t|didnt|do|does|doesnt|doesn’t|how|if|is|not|should|shouldnt|shouldn’t|was|were|werent|weren’t|what|when|where|who|why|won’t|wont|would|wouldn’t|wouldnt)”) then “Question”
ELSE “Not”
END
Missed Clicks (Metric)
Impressions – Clicks
Step 7: How To Use & Update This Report
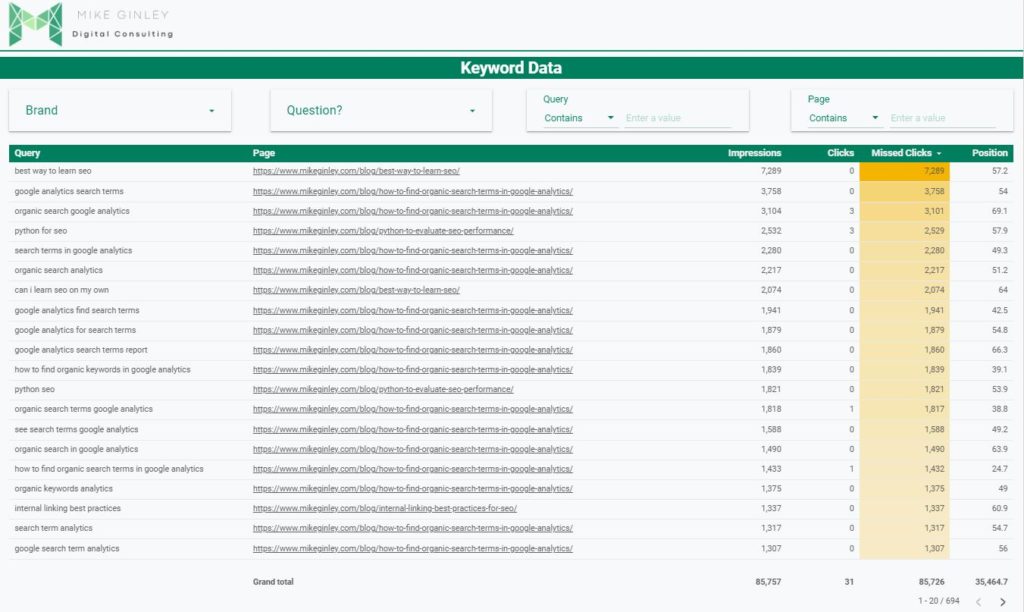
Now you have a Data Studio report that houses numerous terms, their corresponding page, clicks, impressions and more. This should give you great insight into what is working and what isn’t. Using BigQuery really speeds this up too. If you hover over the table you will see a lightning bolt that says ‘Accelerated by BigQuery BI Engine’. This is why we wanted to use BigQuery. Data Studio is so powerful, but the more data you load, the slower it will be. BigQuery takes care of that.
I have it sorted by Missed Clicks which is a custom metric to show us what is getting impressions, but not clicks. Just a way to quickly see where we can improve.
When you want to update this report all you will need to do is repeat the steps in Google Sheets. Just request the data with the new time frame, and upload it to the same BigQuery table with the same schema. Make sure to Truncate it, that will overwrite the data instead of just adding it onto it. I like to do Year To Date as my time frame so I’m technically never losing data, just updating it.
You can also use the Search Analytics tool to take monthly copies of your data to get past the time limit in Google Search Console, just save them as additional sheets in your master spreadsheet.
I also find it really helpful to have the Brand and Question Filter. Everyone should have solid brand rankings so it’s nice to quickly filter those out and see real opportunities. Then you can also see the questions your users are searching for. Are you answering those better than anyone else? If not you gotta get to work!
If you run into any issues with this report please reach out to me on my contact page or on Twitter!
Google Data Studio Resources
- LearningSEO.io – https://learningseo.io/complement-knowledge/
- MeasureSchool – https://measureschool.com/category/google-data-studio/
- Online Metrics – https://online-metrics.com/google-data-studio/
- HubSpot – https://blog.hubspot.com/marketing/google-data-studio

